

|
|
|
This page explores novel ways of visualising software design and of watching software execute. The "world of cells" metaphorFor example, imagine your running software as a body of cells, each cell representing an instance of a class. Each object / cell lives in a community of objects, sending messages to other objects, storing data and providing behaviour exposed as methods.  OO software as biological cells Like in UML, the top half of the cells are storage (primitive data including pointers to other cells) and the bottom half represents the available public methods of the object. The red lighting symbol Imagine being able to pan around and view different aspects of this running software model. The technique used by the information organiser the brain might be one cool way to browsing, navigate and perhaps organise such "computational space". Animating UMLThere is a UML animation system called Rhapsody - you can watch your UML actually execute -they call it "executable UML-based application development". Though I haven't actually see it run (gotta pay money for that privilege). I'd be interested to see how they handle sequence diagrams, since sequence diagrams are not syntactically expressive enough to precisely model for loops and if statements to a practical, executable level. Debuggers as visualisersOf course debuggers are the most obvious tools we have today for watching software execute. We can watch variables and see the current execution point etc. There is a java visualisation debugger that is amazing when watching multiple threads. The python for windows debugger is pretty amazing too. You can drill inside namespaces, objects and classes ad-infinitum. Even methods are objects, which have properties. Its not animation but its an interesting hierarchical visualisation of computational space and name space. P.S. What sort of interesting "spaces" are there in software? The Jbuilder 2 Bible by Armstrong has some fantastic descriptions of how software and objects operate and interact. Visualisations using gui componentsIn my old Multimedia Toolbook programming days, if I was prototyping an application and I needed a datastructure to hold a list of strings, and if that data was something I might want to watch change during program execution then I would use a visual GUI component to hold that data. This way I could always 'see the data' and watch it change. After development I simple made the GUI elements (that would make no sense to the user) invisible but still operational. Normally a programmer would choose a non visual datastructure, which would of course be many times more efficient than storing the data in a GUI component. It is also considered bad practice to couple your 'model' with GUI. However for prototyping, the advantages are instant and often beautiful visualisations, since you can also change the fonts, colors and placement of such GUI elements to produce pleasing visualisation layouts. Note: this technique of using gui components as data structures is just a thought provoking idea of how to achieve visualisation of program innards and program behaviour. I am not advocating that you build your serious programs in this way. Static representaion of "wiring"I also like the Visual Age for Java technology, the way you can draw links between components. UML doesn't cover this sort of 'real world' representation of the wiring between GUI components on a form and objects in your model/application. Check out a tutorial on how Visual Age uses the wiring paradigm.
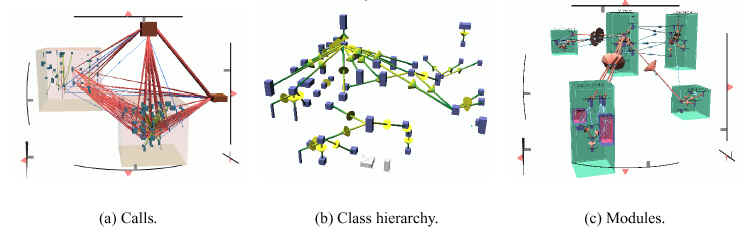
Delphi 6 is starting to represent this sort of hitherto 'hidden' and unvisualised information visually - both data diagrams and now the form designer have an extra tab, which lets you view your components schematically and see the wiring between them. Relevant to visualisation is how you make the wirings. It is worth noting that rather than dragging lines between components in order to wire them older version of Delphi have always provided helpful combo boxes on all components to allow designers to quickly make wirings between components. For example, certain component properties are settable at design time. The programmer selects an object from the combo box in order to make the wiring (ie. set the property). The combobox for each property lists all the components on the enclosing form that the property could possibly point / be wired to. Software VisualisationThere seems to be some serious work being done in this field. Check out Software Visualization in Prolog by Calum A. McK. Grant (as a Dissertation submitted for the degree of Doctor of Philosophy) which has astonishing pictures of software visualisation tools and visual programming systems e.g.
The quicksort algorithm written in ProGraph. Also check out Vmax http://www.cl.cam.ac.uk/Research/Rainbow/vmax/sshot.html
Revised: 08 Jul 2008 19:59:24 -0600.
Ideas from you!
CommentsDebuggers are dynamic, automated ways of producing model-view-controller visualisations of your data, except they attach to ANY software application and reveal it, visually. - J. Alkub
CommentsThe trouble with most debuggers is that you have to explicitly set up each watchpoint. This is efficient of course but boring. Some frameworks (e.g. Toolbook, PythonWin) have debuggers that show all data variables instantly. You can drill down for more, but never do you have to create a variable watch entry manually. - C. Bloom
|